
Home Dashboard
Your Business at a Glance
The Home screen is a live dashboard. It doesn't store any data of its own — every number you see is pulled automatically from what you've entered across Trips, Fuel, Settlements, and Out of Pocket Expenses. Open the app and your business picture is right there, no math required.
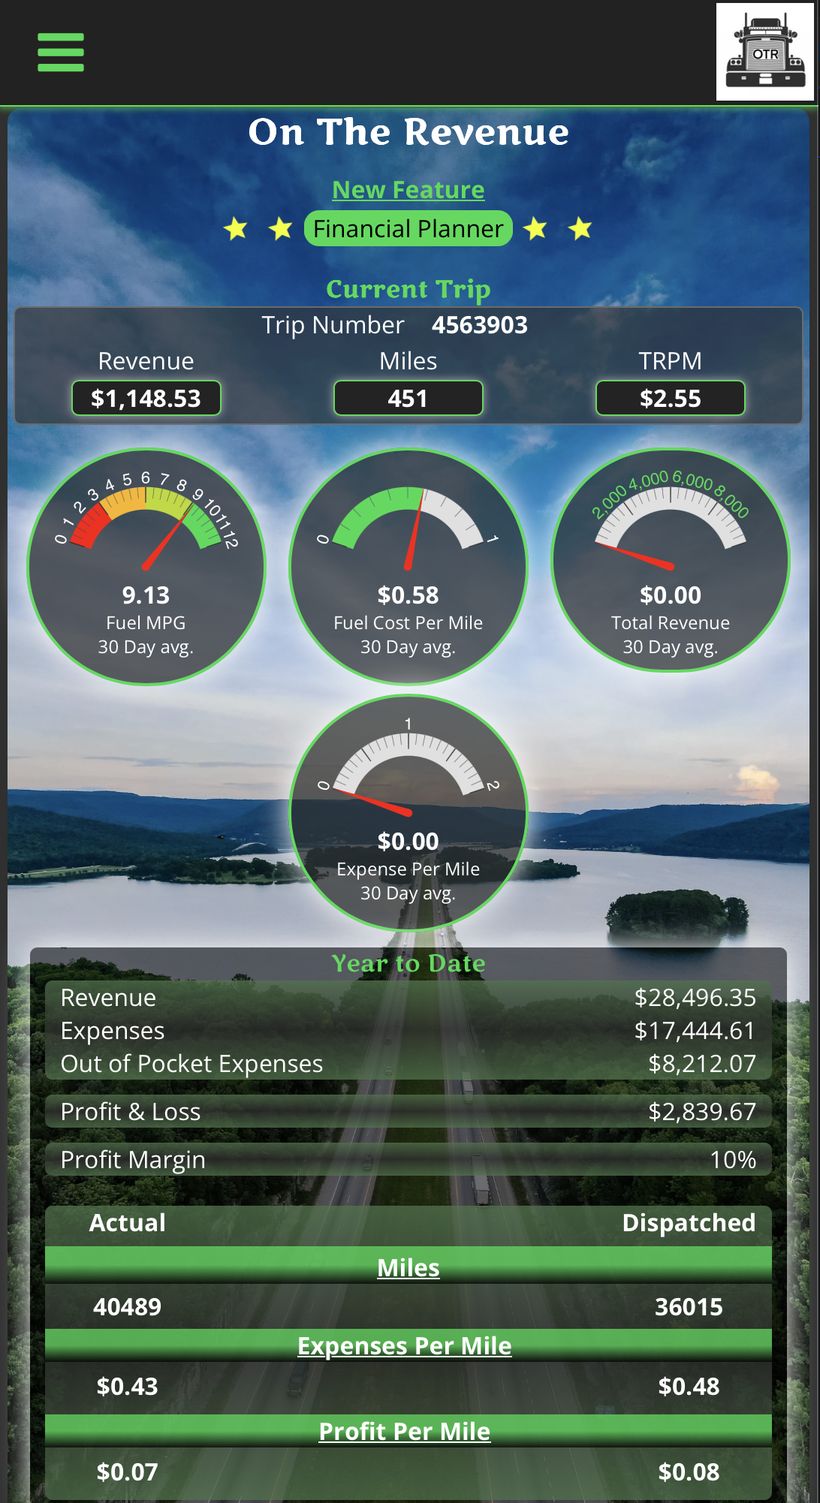
Home Dashboard — Current Trip, 30-day gauges, and Year to Date summary
New Feature Banner
At the top of the screen, a banner highlights the latest addition to OTR. Tap it to go directly to that feature.
Current Trip
Shows the trip currently in progress — pulled from your most recent open trip in the Trips section.
| Field | What It Shows |
|---|---|
| Trip Number | The load or dispatch number for your current trip |
| Revenue | Total revenue entered for this trip so far |
| Miles | Miles logged for this trip |
| TRPM | Total Rate Per Mile — all-in earnings per mile for this trip |
30-Day Average Gauges
Four gauges show rolling 30-day averages — updated automatically as you enter data.
| Gauge | What It Measures |
|---|---|
| Fuel MPG | Average miles per gallon over the last 30 days — from Fuel entries |
| Fuel Cost Per Mile | Average fuel cost per mile over the last 30 days |
| Total Revenue | Average weekly revenue over the last 30 days — from Trips |
| Expense Per Mile | Average operating expense per mile over the last 30 days |
How to Read the Gauges
Each gauge has a color-coded needle. The further into the green, the better your performance in that category. These update automatically — the more data you enter, the more accurate they become.
Year to Date
A running summary of your business performance for the current calendar year.
| Field | What It Shows |
|---|---|
| Revenue | Total gross revenue from all settlements YTD |
| Expenses | Total expenses deducted from settlements YTD |
| Out of Pocket Expenses | Total out-of-pocket spend logged YTD |
| Profit & Loss | Revenue minus all expenses — your net YTD |
| Profit Margin | What percentage of gross revenue you're actually keeping |
Actual vs Dispatched Comparison
Shows the difference between what the carrier dispatched you for and what you actually ran — pulled from your odometer readings in Trips.
| Field | Actual | Dispatched |
|---|---|---|
| Miles | Miles driven based on odometer readings | Miles the carrier quoted for your loads |
| Expenses Per Mile | Your cost per actual mile driven | Your cost per dispatched mile |
| Profit Per Mile | Your profit per actual mile driven | Your profit per dispatched mile |
Why This Matters
Dispatched miles are what the carrier pays you for. Actual miles are what you drove — including deadhead. If your actual miles are significantly higher than dispatched, your real cost per mile and profit per mile are worse than the carrier's numbers suggest. OTR shows you both so you know exactly where you stand.
Nothing to Enter Here
The Home screen is read-only. Every number updates automatically as you enter data in Trips, Fuel, Settlements, and Out of Pocket Expenses. The more consistently you keep those sections up to date, the more accurate your dashboard becomes.